Our bi-weekly Opinion provides you with latest updates and analysis on major capital market and financial investment industry issues.
The Structural Backdrop to the Rise in Long-Term US Treasury Yields and Its Implications
Publication date Sep. 22, 2026

Summary
Since the end of June, the rise in long-term US Treasury yields has been driven by the term premium and real rates rather than by monetary policy expectations or inflation concerns. Estimates are subject to methodological uncertainty, but the factors most often cited in the market—expanded AI-related bond issuance, an erosion of the safe-asset premium on US Treasuries, and uncertainty about Federal Reserve policy—are not sufficient on their own to account for the steepness of the recent increase. This article looks instead at a change in the structure of demand in the Treasury market that amplifies rate shocks. As price-insensitive official holders such as central banks have shrunk in importance and price-sensitive private investors have taken on more duration risk, a structure has emerged in which concerns about long-dated bonds pass through quickly into higher yields. Because the private money that replaced official demand is itself exposed to leverage and redemption risk, the tail risk around yield movements has grown as well. This is not confined to the United States: it should be seen as a structural change facing the sovereign bond markets of the euro area, Japan and other major advanced economies alike. For Korea, a further rise in the US term premium could affect not only domestic long-term yields but also the won and the equity market, so the supply-demand conditions of the global sovereign bond market and the channels of spillover into domestic financial markets warrant close monitoring.
The US 10-year Treasury yield rose to around 4.7% in August 2026 and has been fluctuating near its high for the year, while the 30-year yield touched 5.31%, its highest level since 2007. In the first half of this year long-term yields rose on expectations of policy rate hikes, but since the end of June an unusual pattern has emerged in which long-term yields have risen further even as expected short rates have declined. The market has pointed to larger bond issuance by big AI firms, a weakening of the safe-asset status of US Treasuries, and reduced Federal Reserve communication as possible causes. This article examines the character of the recent rise in long-term yields and the explanatory power of the main factors cited in the market, then considers how the reshaping of the Treasury demand base has raised the market's sensitivity to rate shocks, and discusses how long this may persist and what it implies for Korean financial markets.
Decomposing the rise in long-term US Treasury yields
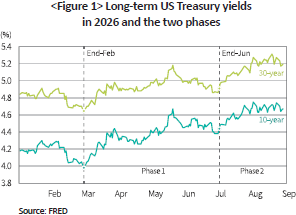
A long-term nominal yield can be decomposed in two ways. One separates it into the expected path of future short rates and the term premium1); the other divides it into the real rate and expected inflation. As Figure 1 shows, long-term yields have risen twice this year, and the composition of the two phases was exactly the opposite. In the increase from the late-February trough to the end of June (47bp at the 10-year point), expected short rates rose 56bp on anticipation of monetary tightening in the wake of the war with Iran, while the term premium actually fell 9bp; the 30-year yield rose less (27bp) than the 10-year, so the yield curve flattened.
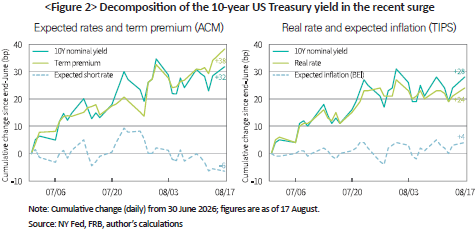
Since the end of June, however, as Figure 2 shows, the rise has been led by the term premium and the real rate. Expected short rates actually fell (-6bp), while the term premium accounted for virtually the entire increase (38bp); on the inflation side, the real rate (24bp) explained most of the move rather than expected inflation (4bp). In this phase the 30-year yield rose 40bp, outpacing the 10-year (28bp), so the curve steepened again—consistent with a term-premium-led increase, since longer duration requires greater compensation for risk. In short, the recent jump in yields can be read as an increase in the compensation demanded for risk in the real-rate space.
The limited explanatory power of the factors cited in the market
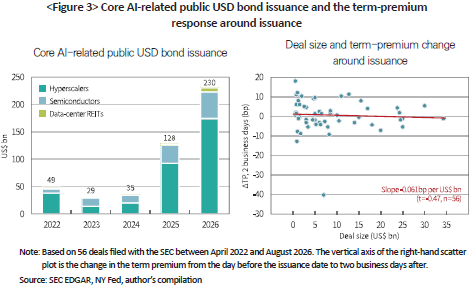
The factor cited most often in the market is the expansion of AI-related bond issuance. As the left panel of Figure 3 shows, public USD bond issuance by AI-related firms—hyperscalers, semiconductor companies and data-center REITs—surged from USD 29 billion in 2023 to USD 230 billion through August 2026. It is difficult, however, to argue that this issuance explains much of the recent rise in long-term Treasury yields. The right panel of Figure 3 plots, for the 56 deals issued between 2022 and August 2026, the change in the term premium from the day before the filing to two business days after, against deal size. There is no evidence that larger deals were associated with larger increases in yields, and the average change in the term premium around issuance was only +0.4bp, effectively zero. This test captures the immediate reaction at the time of the filing, so it cannot rule out a channel through which supply that was anticipated in advance is absorbed gradually. Even when the entire issuance volume is evaluated on a duration-equivalent basis, however, the estimated effect on the term premium is only around 6bp.2) Goldman Sachs likewise recently estimated that AI-related bond issuance over the past year raised other firms' borrowing costs by about 5bp, concluding that the crowding-out effect has been limited.3)
The price adjustment associated with greater AI-related bond issuance is showing up clearly in the credit market for the issuers themselves rather than in Treasuries. Spreads and CDS for the major AI firms have widened beyond the investment-grade average, and bid-to-cover ratios on new issues have fallen.4) Spreads for investment grade as a whole and for high yield, by contrast, are little changed from a year ago. In short, the price adjustment from AI bond issuance is appearing locally in the credit spreads of the issuers rather than in Treasuries, so the recent jump in Treasury yields cannot be explained by AI bond issuance alone.
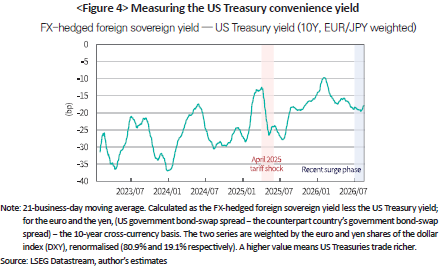
A second hypothesis—that yields have risen because the convenience yield on US Treasuries has been eroded—was also tested. The convenience yield is the return investors are willing to give up in exchange for the safety and liquidity of US Treasuries, that is, the degree to which Treasuries trade rich relative to substitutes such as German or Japanese government bonds. If fiscal deterioration and waning confidence in the dollar were causing this premium to disappear, yields could rise even without supply pressure, which would provide grounds for reading the recent surge as a weakening of the safe-asset status of US Treasuries. The absolute level of the convenience yield, however, also reflects country-specific supply-demand and hedging conditions such as the cross-currency basis, which makes simple cross-country comparisons difficult; what follows therefore tests not the level at a given point in time but the change during the recent surge relative to other episodes. Measuring the convenience yield on this basis5) yields no evidence, as Figure 4 shows, that it contracted further to any significant degree during the recent surge. This contrasts with the April 2025 tariff shock, when concerns about safe-asset status were actually raised and the convenience yield narrowed sharply.6) There is therefore no clear basis for attributing the recent rise in yields to a weakening of the safe-asset status specific to the United States.
Another candidate is the reduction in monetary policy communication. Since taking office, Fed Chair Kevin Warsh has changed the Fed's communication so that it provides virtually no guidance on the future policy path, and it has been argued that this raises uncertainty about the policy path and leads investors to demand greater compensation for holding duration. Indeed, on 29 July, at the second FOMC meeting since he took office, expected short rates fell 5.4bp while the term premium rose 12.4bp. On the same day, however, oil prices jumped more than 6% in the aftermath of the war with Iran, and most of the increase in nominal yields showed up as higher expected inflation, so the oil shock appears to account for a substantial part of that day's move. Moreover, of the 38bp increase in the term premium over the phase as a whole, the 26bp excluding that day accumulated without being attributable to any particular event day, and implied volatility in the bond market—which should have risen if a change in the communication regime were a persistent driver—did not increase either. It is therefore difficult to explain two months of term-premium increases by the communication factor alone. What deserves attention instead is that the 10-year yield rose 2.2bp even though high-frequency identification points to a dovish policy surprise (−6.3bp).7) That long-term yields rose despite a dovish surprise means that the compensation demanded for duration risk widened by more than enough to offset the decline in expected short rates. This suggests the market is now reacting more sensitively than in the past to new information about duration risk, and that this heightened sensitivity may be connected to the structural change in the Treasury demand base examined below.
The reshaping of the Treasury demand base that amplifies rate shocks
Methodological limitations mean the analysis above cannot completely rule out a contribution from any individual factor, but it is clear that no single factor explains the recent rise in yields. What this article focuses on is not the immediate trigger of the surge but the structural conditions in the Treasury market that amplify concerns about long-dated bonds into large moves in yields.
The key question is who absorbs the additional supply of Treasuries. US federal debt more than doubled from 59% of GDP in 2003 to 125% in 2021, yet over the same period the term premium fell by roughly 300bp, from 234bp to -67bp. The term premium declined despite the sharp increase in supply because much of the additional debt was absorbed by investors who were not sensitive to price. As the left panel of Figure 5 shows, the official sector—the Federal Reserve and foreign central banks—was a major pillar of Treasury demand during the 2010s. These holders are relatively inelastic to price changes given their monetary policy or reserve management objectives, whereas private investors adjust their required yields in line with duration risk. For a given volume of issuance, therefore, the larger the share absorbed by private investors, the higher the term premium that may be required to clear the market.
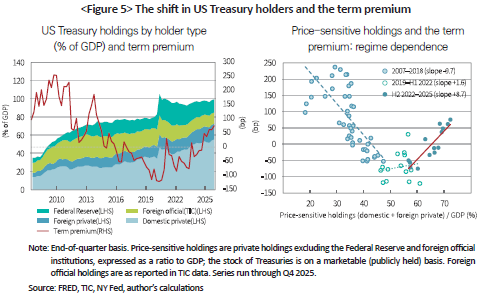
This holding structure has changed markedly since 2022. Quantitative tightening reduced the Federal Reserve's Treasury holdings by USD 1.7 trillion between 2022 and 2025, and foreign official holdings also began to decline in absolute terms. As a result, the official sector's share of US Treasuries, which had been about half (46%) up to 2016, fell to 27% at end-2025, while the price-sensitive private holdings that took its place rose from 53.9% of GDP at end-2021 to 72.4% at end-2025. How this shift in holders relates to the term premium is shown in the right panel of Figure 5. During 2007-2018, when quantitative easing dominated, price-sensitive holdings relative to GDP and the term premium were negatively related, and from 2019 to the first half of 2022 there was no clear relationship. Since the second half of 2022, however, when the Fed began transferring duration to the market through quantitative tightening, a strong positive relationship has emerged in which a 1 percentage point increase in price-sensitive holdings relative to GDP is associated with a roughly 8.7bp rise in the term premium. This shows that the term premium is closely connected not only to the volume of Treasury supply but also to the character of the investors absorbing it.8)
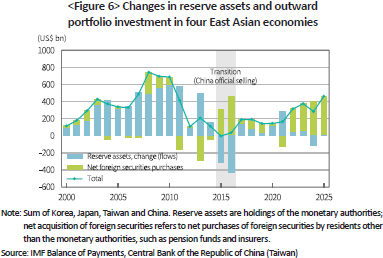
Behind this reshaping of the holding structure lies, alongside the Fed's quantitative tightening, a shift in who exports capital to the United States from current account surplus countries—from the official sector to the private sector. Before the global financial crisis, surplus countries offset appreciation pressure on their currencies by accumulating foreign exchange reserves, and much of the surplus flowed into US Treasuries through the official sector.9) More recently, however, as Figure 6 shows, private investors in surplus countries—pension funds, insurers and households—have expanded their investment in US risk assets, so that appreciation pressure is increasingly offset through private outward capital flows rather than reserve accumulation. Unlike a shift in central bank policy, this change in the agents of capital export is a structural one that is hard to reverse quickly, and market participants and policymakers alike have pointed to it as a key reason for the reshaping of the Treasury demand base.10)
This reshaping of the demand base is not a US phenomenon alone. At the same time as the Fed's quantitative tightening, the Bank of Japan ended yield curve control and the European Central Bank halted bond reinvestment, so that in the major economies alike private investors have taken on the duration risk that central banks have set down. Nor is there any sign of the supply side easing. Domestic political conflict and populist demands have weakened the capacity of major economies to pursue fiscal reform, while pension and healthcare spending driven by population ageing is rigid and hard to reverse quickly, and higher defence spending since the Russia-Ukraine war has become a new burden.11) As noted above, the level of debt does not by itself determine yields, but with this supply pressure bearing down on a thinner absorptive capacity, risk compensation and yield volatility in sovereign bond markets are likely to remain high.
No less important than the shift of Treasury demand towards the private sector is the fact that part of that demand is supported by leveraged arbitrageurs, which raises the tail risk around yield movements. Hedge funds' long positions in US Treasuries rose from USD 0.9 trillion at end-2022 to USD 2.5 trillion at end-2025, and the repurchase agreement (repo) borrowing that supports them expanded from USD 1.2 trillion to USD 3.4 trillion over the same period. When funding conditions are good, these arbitrageurs lower the term premium by absorbing volumes that dealers cannot take on; but when margins are raised or the repo market seizes up, they are forced to cut positions, which can sharply weaken the market's absorptive capacity instead.12) The repo market turmoil of September 2019 and the dash for cash of March 2020 are the leading examples. Ultimately, the possibility that the yield response to a shock is amplified non-linearly also warrants attention.
The US Treasury's response and its limits
The way the United States has responded is notable. In mid-August the US Treasury doubled its buyback cap for the 10- to 30-year sector from USD 2 billion to USD 4 billion per operation. Buying long-dated bonds and replacing them with bill issuance reduces the duration held by the private sector, and so has a portfolio rebalancing effect similar to quantitative easing. Indeed, high-frequency identification studies around Treasury issuance announcements report that changes in the maturity composition have macroeconomic effects equivalent to those of monetary policy shocks.13) Such measures to ease the duration burden do not stop at buybacks. Alongside supporting the defence of the Japanese yen through joint intervention, the US Treasury is reported to be pursuing the use of the Fed's FIMA Repo Facility so that Japan can raise dollars against its US Treasury holdings without selling them in the market. This too serves a purpose similar to the buybacks, in that it restrains an increase in market supply through Japanese sales of US Treasuries.
The question is sustainability. Unlike a central bank, which funds asset purchases through its power of issue, the Treasury funds its purchases by issuing short-dated debt, so the more it buys, the more rollover risk and interest rate sensitivity accumulate at the fiscal authority. And because the money used to buy bills comes out of reserve balances, greater bill issuance can drain reserves and tighten short-term funding markets.14) Furthermore, Treasury yields are an important price signal reflecting the market's assessment of fiscal sustainability, and it has been pointed out that absorbing sales as a matter of policy weakens that signal and dulls the incentive for fiscal adjustment.15) If this amounts only to deferring the problem without real fiscal reform, central bank asset purchases may become unavoidable as the fiscal limit approaches, ultimately leading to a path in which the real debt burden is adjusted through higher inflation. The Economist likewise identifies inflation as the most likely adjustment path for advanced-economy debt, on the grounds that spending cuts, high growth, tax increases and default are all difficult.16) Seen in this light, the 0.7% fall in the dollar index on the day the buybacks were announced suggests the market may have focused not only on their short-term stabilising effect on yields but also on the limits to their sustainability.
Implications for Korea
The first is the exchange rate. US rate shocks have typically been accompanied by a stronger dollar and a weaker won, but this time a new combination has emerged: a rising US term premium alongside a weaker dollar. The decline in the won-dollar rate from a peak of around 1,550 won to the recent 1,360-70 won range can be read as partly reflecting dollar weakness driven by US fiscal concerns. US fiscal strain works on the won through two opposing channels. One appreciates the won through a weaker dollar; the other depreciates it as a surge in US yields spreads into risk aversion in global financial markets. The former has dominated so far, but if the adjustment in the US Treasury market spreads into abrupt market stress, the latter could gain force and reverse the direction of the exchange rate—a possibility that warrants attention.
The second is the equity market. In a phase where rising yields are driven by the term premium and real rates, growth stocks that depend on future cash flows are hit hardest by the rise in discount rates. On 19 August the KOSPI fell 5.8% in the wake of the surge in long-term US Treasury yields, and the contagion to the domestic market was evident, with a sell-side sidecar triggered. Because the correlation between US Treasury yields and equity prices has fallen sharply over the past five years, bonds now cushion equity corrections less effectively; if a further rise in long-term US yields leads to a correction in US equities, contagion to the domestic market through weaker risk appetite and foreign capital outflows warrants attention.
The third is the Korea Treasury Bond (KTB) market. Long-term KTB yields have recently been driven largely by domestic factors, including greater supply of ultra-long maturities and a weakening of insurers' buying base. Given that Korean long-term yields have historically been sensitive to changes in the US term premium, a continued reshaping of the global sovereign demand base and a further rise in the US term premium could add external pressure to KTB yields that domestic factors have already pushed up. The effects would not stop at the KTB market. Because KTB yields serve as the benchmark for bank debentures and corporate bonds, higher long-term yields raise private sector funding costs, and the burden grows further if deepening risk aversion also widens credit spreads. In particular, with policy rate hikes resuming since July, monetary tightening is working on short-term rates and a rising term premium on long-term rates, creating upward pressure across the yield curve. For household loans, where floating rates account for a large share, such increases can pass through quickly into interest burdens, and the possibility that weaker repayment capacity and higher delinquency rates emerge among vulnerable borrowers such as marginal firms and the self-employed also warrants attention.
1) Term premium estimates follow Adrian, T., Crump, R., Moench, E., 2013, Pricing the term structure with linear regressions, Journal of Financial Economics 110(1), 110-138.
2) Converting the USD 230 billion of AI-related public USD bond issuance in 2026 into 10-year equivalents on the basis of its maturity composition gives about USD 224 billion, or 0.7% of GDP; applying the slope from Figure 5 below (8.7bp per 1 percentage point of private holdings relative to GDP) implies an effect on the term premium of about 6bp. The size-weighted average duration of the 56 deals in the sample is 10.3 years, a segment close to the 10-year Treasury, so the 10-year term premium was also used as the dependent variable in the issuance-day response test.
3) Goldman Sachs, 2026. 8. 10, What Is AI Investment Crowding Out?, US Economics Analyst.
4) According to the Korea Center for International Finance (2026. 8. 14, Spread and CDS trends for US AI corporate bonds and their implications), the average spread of the ten major AI firms widened from 59bp to 94bp over the year, their 5-year CDS ran well above the investment-grade average, and the bid-to-cover ratio on new AI bonds fell from 4.4 times in Q3 2025 to 1.7 times at end-July 2026.
5) Measured as the difference between the 10-year government bond-swap spreads of the United States and Germany and of the United States and Japan, less the cross-currency basis, which is the cost of FX hedging; the method follows Du, W., Im, J., Schreger, J., 2018, The U.S. Treasury premium, Journal of International Economics 112, 167-181.
6) For a study interpreting the April 2025 episode, in which dollar weakness coincided with rising US yields, as a narrowing of the safe-asset premium on US Treasuries, see Jiang, Z., Krishnamurthy, A., Lustig, H., Richmond, R., Xu, C., 2025, Dollar Upheaval: This Time is Different, Working Paper.
7) High-frequency monetary policy surprises are measured as changes in interest rate futures prices within narrow windows around the FOMC statement and the press conference. The data are from the San Francisco Fed’s U.S. Monetary Policy Event-Study Database.
8) On the argument that the effect of a given supply on the term premium depends on the price sensitivity of holders, see Vayanos, D., Vila, J.-L., 2021, A preferred-habitat model of the term structure of interest rates, Econometrica 89(1), 77-112.
9) The structure in which reserve accumulation by East Asian surplus countries through FX intervention financed the US current account deficit before the global financial crisis was described as a ‘revived Bretton Woods system’. See Dooley, M. P., Folkerts-Landau, D., Garber, P., 2003, An essay on the revived Bretton Woods system, NBER Working Paper No. 9971.
10) Financial Times, 2026. 8. 21, “Treasury demand has become materially more valuation-sensitive”; Wall Street Journal, 2026. 8. 18, “High Anxiety in the Bond Market”.
11) In its April 2026 World Economic Outlook, the IMF projects that the US fiscal deficit will remain entrenched at 7% of GDP through 2031 and that Japan’s will widen from around 1% in 2025 to 4%, while the euro area’s is expected to stay at around 3%.
12) Schrimpf, A., Shin, H. S., Sushko, V., 2020, Leverage and margin spirals in fixed income markets during the Covid-19 crisis, BIS Bulletin No. 2.
13) Endo, H., Pallara, K., Sfregola, M., Zanotti, L., 2026, The Treasury Does Monetary Policy, Working Paper.
14) In September 2019, when the settlement of large Treasury auctions drained reserves and SOFR rose above 5% on 17 September, the Fed began purchasing Treasury bills from October.
15) Lustig, H., 2026, America’s Risky Debt: What Markets See That Policymakers Don’t, in The American Economy in a New Era, Aspen Institute.
16) The Economist, 2025. 10. 18, The case against holding bonds.
Decomposing the rise in long-term US Treasury yields
A long-term nominal yield can be decomposed in two ways. One separates it into the expected path of future short rates and the term premium1); the other divides it into the real rate and expected inflation. As Figure 1 shows, long-term yields have risen twice this year, and the composition of the two phases was exactly the opposite. In the increase from the late-February trough to the end of June (47bp at the 10-year point), expected short rates rose 56bp on anticipation of monetary tightening in the wake of the war with Iran, while the term premium actually fell 9bp; the 30-year yield rose less (27bp) than the 10-year, so the yield curve flattened.
Since the end of June, however, as Figure 2 shows, the rise has been led by the term premium and the real rate. Expected short rates actually fell (-6bp), while the term premium accounted for virtually the entire increase (38bp); on the inflation side, the real rate (24bp) explained most of the move rather than expected inflation (4bp). In this phase the 30-year yield rose 40bp, outpacing the 10-year (28bp), so the curve steepened again—consistent with a term-premium-led increase, since longer duration requires greater compensation for risk. In short, the recent jump in yields can be read as an increase in the compensation demanded for risk in the real-rate space.
The limited explanatory power of the factors cited in the market
The factor cited most often in the market is the expansion of AI-related bond issuance. As the left panel of Figure 3 shows, public USD bond issuance by AI-related firms—hyperscalers, semiconductor companies and data-center REITs—surged from USD 29 billion in 2023 to USD 230 billion through August 2026. It is difficult, however, to argue that this issuance explains much of the recent rise in long-term Treasury yields. The right panel of Figure 3 plots, for the 56 deals issued between 2022 and August 2026, the change in the term premium from the day before the filing to two business days after, against deal size. There is no evidence that larger deals were associated with larger increases in yields, and the average change in the term premium around issuance was only +0.4bp, effectively zero. This test captures the immediate reaction at the time of the filing, so it cannot rule out a channel through which supply that was anticipated in advance is absorbed gradually. Even when the entire issuance volume is evaluated on a duration-equivalent basis, however, the estimated effect on the term premium is only around 6bp.2) Goldman Sachs likewise recently estimated that AI-related bond issuance over the past year raised other firms' borrowing costs by about 5bp, concluding that the crowding-out effect has been limited.3)
The price adjustment associated with greater AI-related bond issuance is showing up clearly in the credit market for the issuers themselves rather than in Treasuries. Spreads and CDS for the major AI firms have widened beyond the investment-grade average, and bid-to-cover ratios on new issues have fallen.4) Spreads for investment grade as a whole and for high yield, by contrast, are little changed from a year ago. In short, the price adjustment from AI bond issuance is appearing locally in the credit spreads of the issuers rather than in Treasuries, so the recent jump in Treasury yields cannot be explained by AI bond issuance alone.
A second hypothesis—that yields have risen because the convenience yield on US Treasuries has been eroded—was also tested. The convenience yield is the return investors are willing to give up in exchange for the safety and liquidity of US Treasuries, that is, the degree to which Treasuries trade rich relative to substitutes such as German or Japanese government bonds. If fiscal deterioration and waning confidence in the dollar were causing this premium to disappear, yields could rise even without supply pressure, which would provide grounds for reading the recent surge as a weakening of the safe-asset status of US Treasuries. The absolute level of the convenience yield, however, also reflects country-specific supply-demand and hedging conditions such as the cross-currency basis, which makes simple cross-country comparisons difficult; what follows therefore tests not the level at a given point in time but the change during the recent surge relative to other episodes. Measuring the convenience yield on this basis5) yields no evidence, as Figure 4 shows, that it contracted further to any significant degree during the recent surge. This contrasts with the April 2025 tariff shock, when concerns about safe-asset status were actually raised and the convenience yield narrowed sharply.6) There is therefore no clear basis for attributing the recent rise in yields to a weakening of the safe-asset status specific to the United States.
Another candidate is the reduction in monetary policy communication. Since taking office, Fed Chair Kevin Warsh has changed the Fed's communication so that it provides virtually no guidance on the future policy path, and it has been argued that this raises uncertainty about the policy path and leads investors to demand greater compensation for holding duration. Indeed, on 29 July, at the second FOMC meeting since he took office, expected short rates fell 5.4bp while the term premium rose 12.4bp. On the same day, however, oil prices jumped more than 6% in the aftermath of the war with Iran, and most of the increase in nominal yields showed up as higher expected inflation, so the oil shock appears to account for a substantial part of that day's move. Moreover, of the 38bp increase in the term premium over the phase as a whole, the 26bp excluding that day accumulated without being attributable to any particular event day, and implied volatility in the bond market—which should have risen if a change in the communication regime were a persistent driver—did not increase either. It is therefore difficult to explain two months of term-premium increases by the communication factor alone. What deserves attention instead is that the 10-year yield rose 2.2bp even though high-frequency identification points to a dovish policy surprise (−6.3bp).7) That long-term yields rose despite a dovish surprise means that the compensation demanded for duration risk widened by more than enough to offset the decline in expected short rates. This suggests the market is now reacting more sensitively than in the past to new information about duration risk, and that this heightened sensitivity may be connected to the structural change in the Treasury demand base examined below.
The reshaping of the Treasury demand base that amplifies rate shocks
Methodological limitations mean the analysis above cannot completely rule out a contribution from any individual factor, but it is clear that no single factor explains the recent rise in yields. What this article focuses on is not the immediate trigger of the surge but the structural conditions in the Treasury market that amplify concerns about long-dated bonds into large moves in yields.
The key question is who absorbs the additional supply of Treasuries. US federal debt more than doubled from 59% of GDP in 2003 to 125% in 2021, yet over the same period the term premium fell by roughly 300bp, from 234bp to -67bp. The term premium declined despite the sharp increase in supply because much of the additional debt was absorbed by investors who were not sensitive to price. As the left panel of Figure 5 shows, the official sector—the Federal Reserve and foreign central banks—was a major pillar of Treasury demand during the 2010s. These holders are relatively inelastic to price changes given their monetary policy or reserve management objectives, whereas private investors adjust their required yields in line with duration risk. For a given volume of issuance, therefore, the larger the share absorbed by private investors, the higher the term premium that may be required to clear the market.
This holding structure has changed markedly since 2022. Quantitative tightening reduced the Federal Reserve's Treasury holdings by USD 1.7 trillion between 2022 and 2025, and foreign official holdings also began to decline in absolute terms. As a result, the official sector's share of US Treasuries, which had been about half (46%) up to 2016, fell to 27% at end-2025, while the price-sensitive private holdings that took its place rose from 53.9% of GDP at end-2021 to 72.4% at end-2025. How this shift in holders relates to the term premium is shown in the right panel of Figure 5. During 2007-2018, when quantitative easing dominated, price-sensitive holdings relative to GDP and the term premium were negatively related, and from 2019 to the first half of 2022 there was no clear relationship. Since the second half of 2022, however, when the Fed began transferring duration to the market through quantitative tightening, a strong positive relationship has emerged in which a 1 percentage point increase in price-sensitive holdings relative to GDP is associated with a roughly 8.7bp rise in the term premium. This shows that the term premium is closely connected not only to the volume of Treasury supply but also to the character of the investors absorbing it.8)
Behind this reshaping of the holding structure lies, alongside the Fed's quantitative tightening, a shift in who exports capital to the United States from current account surplus countries—from the official sector to the private sector. Before the global financial crisis, surplus countries offset appreciation pressure on their currencies by accumulating foreign exchange reserves, and much of the surplus flowed into US Treasuries through the official sector.9) More recently, however, as Figure 6 shows, private investors in surplus countries—pension funds, insurers and households—have expanded their investment in US risk assets, so that appreciation pressure is increasingly offset through private outward capital flows rather than reserve accumulation. Unlike a shift in central bank policy, this change in the agents of capital export is a structural one that is hard to reverse quickly, and market participants and policymakers alike have pointed to it as a key reason for the reshaping of the Treasury demand base.10)
This reshaping of the demand base is not a US phenomenon alone. At the same time as the Fed's quantitative tightening, the Bank of Japan ended yield curve control and the European Central Bank halted bond reinvestment, so that in the major economies alike private investors have taken on the duration risk that central banks have set down. Nor is there any sign of the supply side easing. Domestic political conflict and populist demands have weakened the capacity of major economies to pursue fiscal reform, while pension and healthcare spending driven by population ageing is rigid and hard to reverse quickly, and higher defence spending since the Russia-Ukraine war has become a new burden.11) As noted above, the level of debt does not by itself determine yields, but with this supply pressure bearing down on a thinner absorptive capacity, risk compensation and yield volatility in sovereign bond markets are likely to remain high.
No less important than the shift of Treasury demand towards the private sector is the fact that part of that demand is supported by leveraged arbitrageurs, which raises the tail risk around yield movements. Hedge funds' long positions in US Treasuries rose from USD 0.9 trillion at end-2022 to USD 2.5 trillion at end-2025, and the repurchase agreement (repo) borrowing that supports them expanded from USD 1.2 trillion to USD 3.4 trillion over the same period. When funding conditions are good, these arbitrageurs lower the term premium by absorbing volumes that dealers cannot take on; but when margins are raised or the repo market seizes up, they are forced to cut positions, which can sharply weaken the market's absorptive capacity instead.12) The repo market turmoil of September 2019 and the dash for cash of March 2020 are the leading examples. Ultimately, the possibility that the yield response to a shock is amplified non-linearly also warrants attention.
The US Treasury's response and its limits
The way the United States has responded is notable. In mid-August the US Treasury doubled its buyback cap for the 10- to 30-year sector from USD 2 billion to USD 4 billion per operation. Buying long-dated bonds and replacing them with bill issuance reduces the duration held by the private sector, and so has a portfolio rebalancing effect similar to quantitative easing. Indeed, high-frequency identification studies around Treasury issuance announcements report that changes in the maturity composition have macroeconomic effects equivalent to those of monetary policy shocks.13) Such measures to ease the duration burden do not stop at buybacks. Alongside supporting the defence of the Japanese yen through joint intervention, the US Treasury is reported to be pursuing the use of the Fed's FIMA Repo Facility so that Japan can raise dollars against its US Treasury holdings without selling them in the market. This too serves a purpose similar to the buybacks, in that it restrains an increase in market supply through Japanese sales of US Treasuries.
The question is sustainability. Unlike a central bank, which funds asset purchases through its power of issue, the Treasury funds its purchases by issuing short-dated debt, so the more it buys, the more rollover risk and interest rate sensitivity accumulate at the fiscal authority. And because the money used to buy bills comes out of reserve balances, greater bill issuance can drain reserves and tighten short-term funding markets.14) Furthermore, Treasury yields are an important price signal reflecting the market's assessment of fiscal sustainability, and it has been pointed out that absorbing sales as a matter of policy weakens that signal and dulls the incentive for fiscal adjustment.15) If this amounts only to deferring the problem without real fiscal reform, central bank asset purchases may become unavoidable as the fiscal limit approaches, ultimately leading to a path in which the real debt burden is adjusted through higher inflation. The Economist likewise identifies inflation as the most likely adjustment path for advanced-economy debt, on the grounds that spending cuts, high growth, tax increases and default are all difficult.16) Seen in this light, the 0.7% fall in the dollar index on the day the buybacks were announced suggests the market may have focused not only on their short-term stabilising effect on yields but also on the limits to their sustainability.
Implications for Korea
The first is the exchange rate. US rate shocks have typically been accompanied by a stronger dollar and a weaker won, but this time a new combination has emerged: a rising US term premium alongside a weaker dollar. The decline in the won-dollar rate from a peak of around 1,550 won to the recent 1,360-70 won range can be read as partly reflecting dollar weakness driven by US fiscal concerns. US fiscal strain works on the won through two opposing channels. One appreciates the won through a weaker dollar; the other depreciates it as a surge in US yields spreads into risk aversion in global financial markets. The former has dominated so far, but if the adjustment in the US Treasury market spreads into abrupt market stress, the latter could gain force and reverse the direction of the exchange rate—a possibility that warrants attention.
The second is the equity market. In a phase where rising yields are driven by the term premium and real rates, growth stocks that depend on future cash flows are hit hardest by the rise in discount rates. On 19 August the KOSPI fell 5.8% in the wake of the surge in long-term US Treasury yields, and the contagion to the domestic market was evident, with a sell-side sidecar triggered. Because the correlation between US Treasury yields and equity prices has fallen sharply over the past five years, bonds now cushion equity corrections less effectively; if a further rise in long-term US yields leads to a correction in US equities, contagion to the domestic market through weaker risk appetite and foreign capital outflows warrants attention.
The third is the Korea Treasury Bond (KTB) market. Long-term KTB yields have recently been driven largely by domestic factors, including greater supply of ultra-long maturities and a weakening of insurers' buying base. Given that Korean long-term yields have historically been sensitive to changes in the US term premium, a continued reshaping of the global sovereign demand base and a further rise in the US term premium could add external pressure to KTB yields that domestic factors have already pushed up. The effects would not stop at the KTB market. Because KTB yields serve as the benchmark for bank debentures and corporate bonds, higher long-term yields raise private sector funding costs, and the burden grows further if deepening risk aversion also widens credit spreads. In particular, with policy rate hikes resuming since July, monetary tightening is working on short-term rates and a rising term premium on long-term rates, creating upward pressure across the yield curve. For household loans, where floating rates account for a large share, such increases can pass through quickly into interest burdens, and the possibility that weaker repayment capacity and higher delinquency rates emerge among vulnerable borrowers such as marginal firms and the self-employed also warrants attention.
1) Term premium estimates follow Adrian, T., Crump, R., Moench, E., 2013, Pricing the term structure with linear regressions, Journal of Financial Economics 110(1), 110-138.
2) Converting the USD 230 billion of AI-related public USD bond issuance in 2026 into 10-year equivalents on the basis of its maturity composition gives about USD 224 billion, or 0.7% of GDP; applying the slope from Figure 5 below (8.7bp per 1 percentage point of private holdings relative to GDP) implies an effect on the term premium of about 6bp. The size-weighted average duration of the 56 deals in the sample is 10.3 years, a segment close to the 10-year Treasury, so the 10-year term premium was also used as the dependent variable in the issuance-day response test.
3) Goldman Sachs, 2026. 8. 10, What Is AI Investment Crowding Out?, US Economics Analyst.
4) According to the Korea Center for International Finance (2026. 8. 14, Spread and CDS trends for US AI corporate bonds and their implications), the average spread of the ten major AI firms widened from 59bp to 94bp over the year, their 5-year CDS ran well above the investment-grade average, and the bid-to-cover ratio on new AI bonds fell from 4.4 times in Q3 2025 to 1.7 times at end-July 2026.
5) Measured as the difference between the 10-year government bond-swap spreads of the United States and Germany and of the United States and Japan, less the cross-currency basis, which is the cost of FX hedging; the method follows Du, W., Im, J., Schreger, J., 2018, The U.S. Treasury premium, Journal of International Economics 112, 167-181.
6) For a study interpreting the April 2025 episode, in which dollar weakness coincided with rising US yields, as a narrowing of the safe-asset premium on US Treasuries, see Jiang, Z., Krishnamurthy, A., Lustig, H., Richmond, R., Xu, C., 2025, Dollar Upheaval: This Time is Different, Working Paper.
7) High-frequency monetary policy surprises are measured as changes in interest rate futures prices within narrow windows around the FOMC statement and the press conference. The data are from the San Francisco Fed’s U.S. Monetary Policy Event-Study Database.
8) On the argument that the effect of a given supply on the term premium depends on the price sensitivity of holders, see Vayanos, D., Vila, J.-L., 2021, A preferred-habitat model of the term structure of interest rates, Econometrica 89(1), 77-112.
9) The structure in which reserve accumulation by East Asian surplus countries through FX intervention financed the US current account deficit before the global financial crisis was described as a ‘revived Bretton Woods system’. See Dooley, M. P., Folkerts-Landau, D., Garber, P., 2003, An essay on the revived Bretton Woods system, NBER Working Paper No. 9971.
10) Financial Times, 2026. 8. 21, “Treasury demand has become materially more valuation-sensitive”; Wall Street Journal, 2026. 8. 18, “High Anxiety in the Bond Market”.
11) In its April 2026 World Economic Outlook, the IMF projects that the US fiscal deficit will remain entrenched at 7% of GDP through 2031 and that Japan’s will widen from around 1% in 2025 to 4%, while the euro area’s is expected to stay at around 3%.
12) Schrimpf, A., Shin, H. S., Sushko, V., 2020, Leverage and margin spirals in fixed income markets during the Covid-19 crisis, BIS Bulletin No. 2.
13) Endo, H., Pallara, K., Sfregola, M., Zanotti, L., 2026, The Treasury Does Monetary Policy, Working Paper.
14) In September 2019, when the settlement of large Treasury auctions drained reserves and SOFR rose above 5% on 17 September, the Fed began purchasing Treasury bills from October.
15) Lustig, H., 2026, America’s Risky Debt: What Markets See That Policymakers Don’t, in The American Economy in a New Era, Aspen Institute.
16) The Economist, 2025. 10. 18, The case against holding bonds.