Our bi-weekly Opinion provides you with latest updates and analysis on major capital market and financial investment industry issues.
Market Liquidity in US Economy: Assessment and Risk Factors
Publication date Jun. 01, 2021

Summary
The US, an economy imposing tremendous impacts on the global economy and the financial markets, has adopted bold monetary and fiscal policy tools to pump in a massive amount of liquidity to the market since being hit by a full-blown pandemic in Spring 2020. As a result, the overall liquidity in the US economy measured by M2 reached an historic level in terms of the share of GDP, and the growth rate. The liquidity gap―the extent of market liquidity as a percent of GDP deviating from the trend data―stood at 11.4 percentage points in the second quarter of 2020 to surpass 6 percentage points for three consecutive quarters until the first quarter of 2021. During the four quarters after the outbreak of the pandemic, this helped accumulate a total of $6.3 trillion worth of excess liquidity that is far more than needed for economic activities such as consumption and investment. The quarterly liquidity gap is expected to accumulate for some time before falling gradually as the US economy rebounds. This is likely to lengthen the overvaluation in the asset market in the short run, which makes it hard to rule out the possibility of a downward reversal in asset prices. Moreover, a delay in macroeconomic policy normalization leading to higher inflationary pressure could inevitably result in monetary tightening much stronger than expected. This could quickly reverse the US economy from the expansionary phase to the recession phase.
In the face of the Covid-19 pandemic in early 2020, governments around the globe competitively pumped in liquidity at the pace and strength unprecedented before. Especially, the US—backed by the key currency—led global monetary and fiscal policy responses, mobilizing liquidity whose sheer scale is much more than just expansionary. At least so far, those actions have paid off in the US. While the US government and the central bank Fed are working together to stop households and the corporate sector from collapsing, the nation managed to develop Covid-19 vaccines and is making progress in vaccination, which is expected to steer the economy into full recovery in the near future. In the real economy and the financial markets, there are even signs of overheating. Against the backdrop, this article tries to explore how the liquidity directly or indirectly supplied by the US government and the Fed changed the nature of liquidity in the overall economy, and to assess the potential risk factors.
US monetary and fiscal policies in the pandemic era
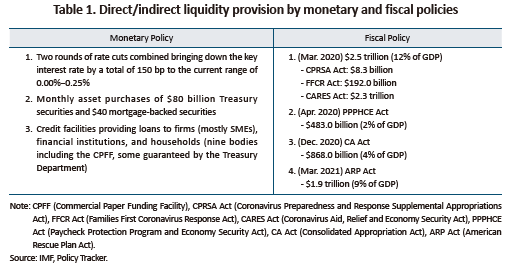
Since the pandemic hit the US, the Fed has carried out bold steps in conventional and non-conventional monetary policy in a bid to lower financial costs and to better cope with liquidity shortages in households, firms, and financial institutions. There are roughly three paths via which the Fed provided liquidity. First, it carried out two rate cuts that combined brought down the key interest rate by a total of 150 bp to the 0.00% to 0.25% range. Also, the Fed is directly buying a monthly average of $120 billion of Treasuries and mortgage securities. Through loans and guarantee programs by several credit facilities, the Fed is also indirectly supporting US households, firms, and financial institutions.1)
Such monetary tools were also complemented by broad-ranged fiscal programs. Since March 2020, the US Congress passed a total of six bills designed to give financial support to firms and households. Included in those legislations are fiscal spending such as disaster relief funds, small business grants, unemployment benefits, guarantees for the Fed’s emergency lending facilities, and other types of emergency expenditures.2) Since the pandemic, the size of fiscal spending passed by the Congress reached about 27% of US GDP.3)
Rapidly rising liquidity via credit creation
The liquidity provided both directly and indirectly by monetary and fiscal policies is spent on consumption, investment, and operational costs for firms and the self-employed, with some of it going unspent to be accumulated as savings. Some may be used to pay off debt. Creation of credit and income is deeply related to not only economic activities such as consumption and investment, but also savings. The result of liquidity provision could be measured by market liquidity, in other words, M2 that is a broad definition of money.4)
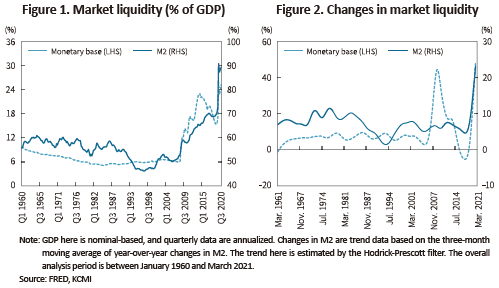
The US has observed its market liquidity rapidly rising since the global financial crisis, but the pace and scale of increases after the outbreak of the pandemic are unprecedented. During the 2010s, market liquidity as a percent of GDP recorded the highest after 1960. More recently, the figure shot up to almost 90%. Although the ratio was rising even before the pandemic, it used to hover around 60% to 70%, which is far lower than it is now. The year-over-year growth in market liquidity also surpassed 20% from around 10% in the past.
The analysis results shown above clearly reflect the massive scale of liquidity creation. But this requires additional confirmation as the pace of growth in financial assets tends to be faster than that of GDP. For that purpose, this article tries to use the liquidity gap that is an estimation of how market liquidity relative to GDP deviates from the trend.5) A positive (+) liquidity gap means the economy having higher market liquidity than the economic activities,6) while a negative (-) one refers to a shortage of market liquidity vis-à-vis economic activities. This is a quite dynamic process in nature. For example, if a central bank takes an accommodative monetary stance during a recession, the liquidity gap will turn positive. It will swiftly turn negative when the policy shifts to tightening as the economy begins to recover.
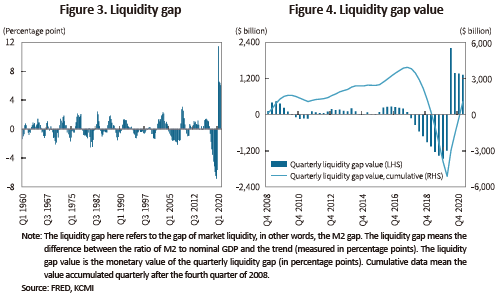
Figure 3 illustrate those characteristics quite well. Prior to the global financial crisis, there were repeated positive and negative gap periods each of which did not last very long. However, during the post-crisis era between the fourth quarter of 2008 and the third quarter of 2017, the positive gap persisted except for some short periods. Despite the long period of the expansionary policy the US maintained after the global financial crisis, the Fed was unable to shift towards tightening, which in the end lengthened the positive liquidity gap. However, the Fed hiked the key interest rate nine times from 0.00%–0.25% finally to 2.25%–2.50% between December 2015 and December 2018, and kept that level until July 2019. This made the liquidity gap began plunging wildly in the fourth quarter of 2017, and the liquidity gap remained in the negative territory for ten quarters. During that period, the quarterly negative liquidity gap recorded the lowest after 1960. That trend began reversing course sharply from the second quarter of 2020 when Covid-19 evolved into a full-blown pandemic in the US. The positive liquidity gap stood at 11.4 percentage points in the second quarter of 2020, hitting the highest since 1960. The quarterly figures were over 6 percentage points until the first quarter of 2021.
Figure 4 illustrates the liquidity gap value that translates the quarterly liquidity gap into the monetary value for a more intuitive understanding. This provides a quarterly picture of excess liquidity vis-à-vis economic activities in the pandemic era. Given that the excess liquidity in the US remained high after the global financial crisis, the analysis period was set between the fourth quarter of 2008 and the first quarter of 2021.
When the pandemic hit the US on a full-blown scale in the second quarter of 2020, the liquidity gap value stood at $2.2 trillion, about 10.5% of US nominal GDP in 2020. During three quarters since then, the quarterly average liquidity gap reached $1.3 trillion to $1.4 trillion, which led to the liquidity gap of $6.3 trillion in aggregate between the second quarter of 2020 and the first quarter of 2021. As mentioned above, the negative liquidity gap was quite drastic between the fourth quarter of 2017 and the first quarter of 2020, which means the excess liquidity accumulated after the global financial crisis was not as large. The excess liquidity accumulated from the fourth quarter of 2008 reached $3.9 trillion in the third quarter of 2017 before beginning to decrease to remain negative until the fourth quarter of 2020. However, the pandemic led to positive liquidity gaps on a quarterly basis, which helped the cumulative excess liquidity turn to positive in the first quarter of 2021. Because accommodative monetary and fiscal policies are expected to linger in the near future, the cumulative excess liquidity could reach a significant level in the short run even if economic activities resume.7)
Risk factors
A positive liquidity gap, in other words, excess liquidity, is a relative concept vis-a-vis economic activities. Hence, liquidity in excess of economic activities could remain in the financial markets and create several risk factors, instead of being invested and consumed in the real economy. At the same time, abundant liquidity helps gross demand to recover, which could also create risk factors. In the US, there are growing concerns about that.
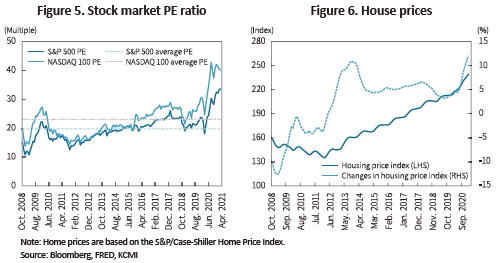
The market liquidity accumulated in the US in the pandemic era pushed up asset prices to high levels, and fueled risk appetite among investors. The US stock market has been long on a rally since the 2008 global financial crisis thanks to massive liquidity created by strong expansionary monetary policy called quantitative easing. Since the middle of 2014 or 2015, the average price-to-earnings ratio of S&P 500 and NASDAQ firms has surpassed the long-term average (November 2008 to April 2021). The US stock market PE ratio briefly fell during the key interest rate hike mentioned above, but began skyrocketing right after the outbreak of Covid-19. As of April 2021, the average PE ratio reached 33.3 for S&P 500 firms and 39.7 for NASDAQ 100 firms, far exceeding 19.4 and 22.7 of the average from October 2008. It is a well-known fact that stock valuation beating the long-term average can never last long. Also equally steep is the upward trend in home prices. Furthermore, there has been growing risk appetite for virtual currency, investment in innovative firms in red, and higher leverage.
As the US government and the Fed are highly likely to keep their current monetary and fiscal policy stance at least for this year, the level of excess liquidity could rise further. Simply put, asset prices and risk preference are likely to grow further. Although Treasury Secretary Janet Yellen and Fed Chairman Jerome Powell remained discreet about overheating, they at the same time expressed concerns about asset prices being overvalued. Such a statement could be behind their intention to induce the market’s self-correction. If overpriced assets fall in value abruptly, this could not only destabilize the financial markets, but also impose a severe impact on the rebounded economy. Such concerns were also mentioned in the Fed’s recently released report.8)
A further delay in macroeconomic policy normalization—in other words, a reduction in massive liquidity—will increase the likelihood of an overheated economy and a surge in inflation. The longer the delay, the stronger the tightening policy will be for easing the overheated economy. In that case, the US economy that managed to rebound briefly could fall back into recession again. For example, Lawrence Summers warned about inflationary pressure that could grow further due to the massive scale of the stimulus plan by the Biden administration. In the same vein, the market’s inflation expectations are recently growing.
It appears that such concerns were partly fueled by doubts about the Fed’s credibility. The Fed already said several times that it would take time for the employment market to make a full recovery, and that until then the average inflation would not reach the Fed’s target of 2%. This implies the Fed taking one step away—for some time being, at least—from its pre-emptive response that has been its monetary policy stance for over three decades. Hence, the market worries about the Fed’s inaction when there is an abrupt surge in inflation expectations that have long remained at 2%. The concern is that in that case the Fed has no option but to implement strong monetary tightening for reining in inflation, which could possibly lead to a severe recession. In short, a delay in the normalization of liquidity provision policy in the pandemic era will possibly lead to another deep recession after a brief economic expansion.
Conclusion
The US economy is a central pillar of the global economy. Korea’s economy too will be tremendously affected by the future of the US economy and financial markets. Since the pandemic, the aggressive macroeconomic policy in the US has imposed positive impacts on the rebound in not only the US, but also the global economy. It seems quite clear that the liquidity the US government and the Fed provided to cope with the crisis generated massive market liquidity via credit creation, and that this helped the economy to rebound quickly. But now the massive liquidity out in the market is creating a new type of risk. Korea should closely monitor the changes in the fiscal and monetary policy stance in the US, and the responses from the economy and the financial markets going forward. If the Korean economy fully recovers from the pandemic-triggered crisis, the next step for Korea is to pay close attention to the issues related to global financial stability.
1) Some of the programs by those credit facilities are guaranteed by fiscal programs of the US Department of Treasury, as described hereinafter.
2) They include the costs related to vaccine development and vaccination, and other financial support to health care facilities.
3) IMF, Policy Tracker.
4) This article defines M2 as “market liquidity” in the US economy. In the US, M2 includes M1 and, in addition, time deposits, CDs, savings deposits, MMDAs, and MMFs. Although the US does not include equity funds and other long-term financial products in M2, M2 defined in this article can be a proper measure of money in circulation because most of the long-term products are rarely traded and the process of those transactions mostly go through M2 products.
5) The liquidity gap (in percentage points) here refers to the result of subtracting M2/Trend of Nominal GDP from M2/Nominal GDP.
6) In general, this is called excess liquidity.
7) Because the US economy is rebounding quickly enough to raise concerns about overheating, the levels of quarterly excess liquidity are expected to go down gradually.
8) Board of Governors of the Federal Reserve System (Financial Stability Report, May 2021)
US monetary and fiscal policies in the pandemic era
Since the pandemic hit the US, the Fed has carried out bold steps in conventional and non-conventional monetary policy in a bid to lower financial costs and to better cope with liquidity shortages in households, firms, and financial institutions. There are roughly three paths via which the Fed provided liquidity. First, it carried out two rate cuts that combined brought down the key interest rate by a total of 150 bp to the 0.00% to 0.25% range. Also, the Fed is directly buying a monthly average of $120 billion of Treasuries and mortgage securities. Through loans and guarantee programs by several credit facilities, the Fed is also indirectly supporting US households, firms, and financial institutions.1)
Such monetary tools were also complemented by broad-ranged fiscal programs. Since March 2020, the US Congress passed a total of six bills designed to give financial support to firms and households. Included in those legislations are fiscal spending such as disaster relief funds, small business grants, unemployment benefits, guarantees for the Fed’s emergency lending facilities, and other types of emergency expenditures.2) Since the pandemic, the size of fiscal spending passed by the Congress reached about 27% of US GDP.3)
The liquidity provided both directly and indirectly by monetary and fiscal policies is spent on consumption, investment, and operational costs for firms and the self-employed, with some of it going unspent to be accumulated as savings. Some may be used to pay off debt. Creation of credit and income is deeply related to not only economic activities such as consumption and investment, but also savings. The result of liquidity provision could be measured by market liquidity, in other words, M2 that is a broad definition of money.4)
The US has observed its market liquidity rapidly rising since the global financial crisis, but the pace and scale of increases after the outbreak of the pandemic are unprecedented. During the 2010s, market liquidity as a percent of GDP recorded the highest after 1960. More recently, the figure shot up to almost 90%. Although the ratio was rising even before the pandemic, it used to hover around 60% to 70%, which is far lower than it is now. The year-over-year growth in market liquidity also surpassed 20% from around 10% in the past.
Figure 3 illustrate those characteristics quite well. Prior to the global financial crisis, there were repeated positive and negative gap periods each of which did not last very long. However, during the post-crisis era between the fourth quarter of 2008 and the third quarter of 2017, the positive gap persisted except for some short periods. Despite the long period of the expansionary policy the US maintained after the global financial crisis, the Fed was unable to shift towards tightening, which in the end lengthened the positive liquidity gap. However, the Fed hiked the key interest rate nine times from 0.00%–0.25% finally to 2.25%–2.50% between December 2015 and December 2018, and kept that level until July 2019. This made the liquidity gap began plunging wildly in the fourth quarter of 2017, and the liquidity gap remained in the negative territory for ten quarters. During that period, the quarterly negative liquidity gap recorded the lowest after 1960. That trend began reversing course sharply from the second quarter of 2020 when Covid-19 evolved into a full-blown pandemic in the US. The positive liquidity gap stood at 11.4 percentage points in the second quarter of 2020, hitting the highest since 1960. The quarterly figures were over 6 percentage points until the first quarter of 2021.
Figure 4 illustrates the liquidity gap value that translates the quarterly liquidity gap into the monetary value for a more intuitive understanding. This provides a quarterly picture of excess liquidity vis-à-vis economic activities in the pandemic era. Given that the excess liquidity in the US remained high after the global financial crisis, the analysis period was set between the fourth quarter of 2008 and the first quarter of 2021.
When the pandemic hit the US on a full-blown scale in the second quarter of 2020, the liquidity gap value stood at $2.2 trillion, about 10.5% of US nominal GDP in 2020. During three quarters since then, the quarterly average liquidity gap reached $1.3 trillion to $1.4 trillion, which led to the liquidity gap of $6.3 trillion in aggregate between the second quarter of 2020 and the first quarter of 2021. As mentioned above, the negative liquidity gap was quite drastic between the fourth quarter of 2017 and the first quarter of 2020, which means the excess liquidity accumulated after the global financial crisis was not as large. The excess liquidity accumulated from the fourth quarter of 2008 reached $3.9 trillion in the third quarter of 2017 before beginning to decrease to remain negative until the fourth quarter of 2020. However, the pandemic led to positive liquidity gaps on a quarterly basis, which helped the cumulative excess liquidity turn to positive in the first quarter of 2021. Because accommodative monetary and fiscal policies are expected to linger in the near future, the cumulative excess liquidity could reach a significant level in the short run even if economic activities resume.7)
A positive liquidity gap, in other words, excess liquidity, is a relative concept vis-a-vis economic activities. Hence, liquidity in excess of economic activities could remain in the financial markets and create several risk factors, instead of being invested and consumed in the real economy. At the same time, abundant liquidity helps gross demand to recover, which could also create risk factors. In the US, there are growing concerns about that.
The market liquidity accumulated in the US in the pandemic era pushed up asset prices to high levels, and fueled risk appetite among investors. The US stock market has been long on a rally since the 2008 global financial crisis thanks to massive liquidity created by strong expansionary monetary policy called quantitative easing. Since the middle of 2014 or 2015, the average price-to-earnings ratio of S&P 500 and NASDAQ firms has surpassed the long-term average (November 2008 to April 2021). The US stock market PE ratio briefly fell during the key interest rate hike mentioned above, but began skyrocketing right after the outbreak of Covid-19. As of April 2021, the average PE ratio reached 33.3 for S&P 500 firms and 39.7 for NASDAQ 100 firms, far exceeding 19.4 and 22.7 of the average from October 2008. It is a well-known fact that stock valuation beating the long-term average can never last long. Also equally steep is the upward trend in home prices. Furthermore, there has been growing risk appetite for virtual currency, investment in innovative firms in red, and higher leverage.
As the US government and the Fed are highly likely to keep their current monetary and fiscal policy stance at least for this year, the level of excess liquidity could rise further. Simply put, asset prices and risk preference are likely to grow further. Although Treasury Secretary Janet Yellen and Fed Chairman Jerome Powell remained discreet about overheating, they at the same time expressed concerns about asset prices being overvalued. Such a statement could be behind their intention to induce the market’s self-correction. If overpriced assets fall in value abruptly, this could not only destabilize the financial markets, but also impose a severe impact on the rebounded economy. Such concerns were also mentioned in the Fed’s recently released report.8)
It appears that such concerns were partly fueled by doubts about the Fed’s credibility. The Fed already said several times that it would take time for the employment market to make a full recovery, and that until then the average inflation would not reach the Fed’s target of 2%. This implies the Fed taking one step away—for some time being, at least—from its pre-emptive response that has been its monetary policy stance for over three decades. Hence, the market worries about the Fed’s inaction when there is an abrupt surge in inflation expectations that have long remained at 2%. The concern is that in that case the Fed has no option but to implement strong monetary tightening for reining in inflation, which could possibly lead to a severe recession. In short, a delay in the normalization of liquidity provision policy in the pandemic era will possibly lead to another deep recession after a brief economic expansion.
Conclusion
The US economy is a central pillar of the global economy. Korea’s economy too will be tremendously affected by the future of the US economy and financial markets. Since the pandemic, the aggressive macroeconomic policy in the US has imposed positive impacts on the rebound in not only the US, but also the global economy. It seems quite clear that the liquidity the US government and the Fed provided to cope with the crisis generated massive market liquidity via credit creation, and that this helped the economy to rebound quickly. But now the massive liquidity out in the market is creating a new type of risk. Korea should closely monitor the changes in the fiscal and monetary policy stance in the US, and the responses from the economy and the financial markets going forward. If the Korean economy fully recovers from the pandemic-triggered crisis, the next step for Korea is to pay close attention to the issues related to global financial stability.
1) Some of the programs by those credit facilities are guaranteed by fiscal programs of the US Department of Treasury, as described hereinafter.
2) They include the costs related to vaccine development and vaccination, and other financial support to health care facilities.
3) IMF, Policy Tracker.
4) This article defines M2 as “market liquidity” in the US economy. In the US, M2 includes M1 and, in addition, time deposits, CDs, savings deposits, MMDAs, and MMFs. Although the US does not include equity funds and other long-term financial products in M2, M2 defined in this article can be a proper measure of money in circulation because most of the long-term products are rarely traded and the process of those transactions mostly go through M2 products.
5) The liquidity gap (in percentage points) here refers to the result of subtracting M2/Trend of Nominal GDP from M2/Nominal GDP.
6) In general, this is called excess liquidity.
7) Because the US economy is rebounding quickly enough to raise concerns about overheating, the levels of quarterly excess liquidity are expected to go down gradually.
8) Board of Governors of the Federal Reserve System (Financial Stability Report, May 2021)