Our bi-weekly Opinion provides you with latest updates and analysis on major capital market and financial investment industry issues.
Changes in Household Assets and Debts: Characteristics and Implications
Publication date Jul. 26, 2022

Summary
In a microdata-based analysis of changes in household assets, the wealth gap between Korea’s households has grown since 2017, primarily driven by real estate assets. Since households with a greater net worth tend to have a larger share of real estate holdings, property price growth contributes to a widening wealth gap. In terms of indebtedness, households with their heads aged under 50 have seen their financial liabilities ballooning due to the increase in housing loans. It is notable that the purpose of loans taken out by household heads under the age of 50 has varied by the size of household net worth. To be specific, the share of loans for leasehold (jeonse) or security deposits has been increasing among households in the bottom 60% net worth segment, while households in the top 40% have a larger share of loans for residential housing purchases.
In Korea, the financial structure of households is susceptible to real estate price fluctuations as they have a relatively larger share of property assets. In this regard, the government should strive to prevent property prices from soaring sharply by managing housing supply and demand and financial conditions. It is also noteworthy that those aged under 50 have recently seen their financial liabilities rising substantially on the back of real estate price increases over the past several years. What is needed at this juncture is thorough preparation to keep financially unstable households from acting as weak points in the economy.
In Korea, the financial structure of households is susceptible to real estate price fluctuations as they have a relatively larger share of property assets. In this regard, the government should strive to prevent property prices from soaring sharply by managing housing supply and demand and financial conditions. It is also noteworthy that those aged under 50 have recently seen their financial liabilities rising substantially on the back of real estate price increases over the past several years. What is needed at this juncture is thorough preparation to keep financially unstable households from acting as weak points in the economy.
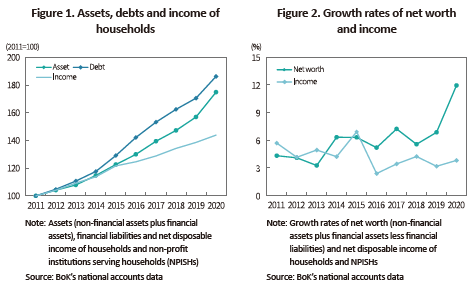
As recent asset price rises have pushed up not only household wealth but also indebtedness, there is a growing interest in how household financial structure changes. According to aggregate measures, household assets and debt are rapidly increasing relative to income (Figure1).
In particular, the household net worth has been growing at a faster pace than income since the mid-2010s backed by asset price increases (Figure 2).
However, the financial structure of individual households may show heterogeneous responses to the aggregate change, depending on the characteristics of each household segment. Against this backdrop, this article intends to explore how household assets and debts have recently changed and discuss relevant implications by examining microdata extracted from the Survey of Household Finances and Living Conditions.1)
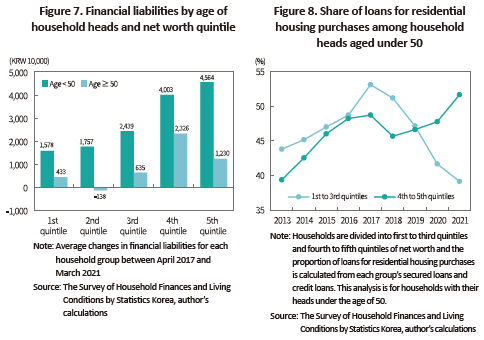
In terms of indebtedness, rising real estate prices have heterogeneous effects across household segments. When compared with households with their heads over the age of 50, financial liabilities held by households with heads aged under 50 have increased more sharply (Figure 7). Loans taken out by household heads under the age of 50 have surged across all net worth quintiles. It is also notable that lower wealth households in the first to third quintiles have seen their financial liabilities rising substantially.
Households with their heads aged under 50 tend to have a relatively lower home ownership rate5) and their housing loans account for the largest proportion of the financial liabilities.6) However, the purpose of loans has varied by net worth quintile. As for the fourth and fifth quintiles, the proportion of loans for the purchase of residential housing has been on the rise while that has declined steeply among households in the first to third quintiles since 2017 (Figure 8).
Implications
In Korea, the financial structure of households is susceptible to real estate price fluctuations as they have a relatively larger share of property assets. A steep rise in real estate prices pushes up the asset value of high-wealth households with a larger share of real assets. However, this could aggravate the burden of raising deposits on lower wealth households, thereby compromising financial soundness. In this respect, the government should strive to prevent property prices from soaring sharply by managing housing supply and demand and financial conditions.
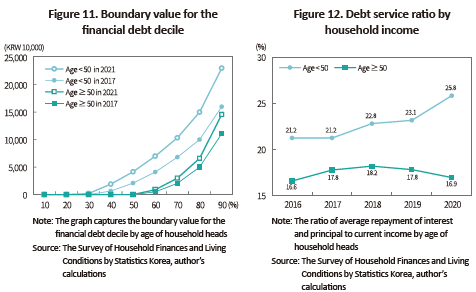
It is also noteworthy that those aged under 50 have recently seen their financial liabilities ballooning due to real estate price increases over the past several years (Figure 11). Such households are increasingly threatened by interest rate rises as the burden of repayment of the principal and interest is growing at a rapid pace (Figure 12). Currently, a shift to monetary tightening in Korea and abroad is raising concerns about an economic slowdown and a greater burden of debt service payment. What is needed at this juncture is thorough preparation to keep financially unstable households from acting as weak points in the economy.
In particular, the household net worth has been growing at a faster pace than income since the mid-2010s backed by asset price increases (Figure 2).
However, the financial structure of individual households may show heterogeneous responses to the aggregate change, depending on the characteristics of each household segment. Against this backdrop, this article intends to explore how household assets and debts have recently changed and discuss relevant implications by examining microdata extracted from the Survey of Household Finances and Living Conditions.1)
Household assets: A widening wealth gap driven by real estate
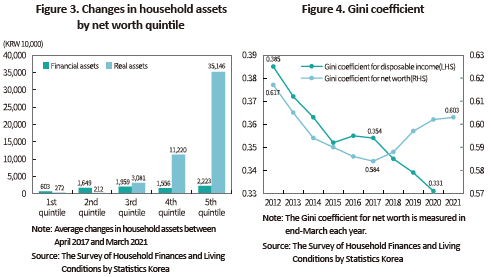
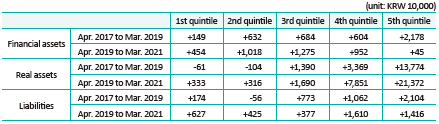
In an analysis of the average amount of household assets by net worth quintile,2) assets held by the households in the top net worth quintile surged between April 2017 and March 2021 (Figure 3). The households in the fourth and fifth quintiles which correspond to the top 40% net worth spectrum have seen their assets going up in value, with around 90% of asset increases stemming from real assets. In terms of real assets, the fourth and fifth quintiles have gained KRW 112 million and KRW 351 million, respectively, which shows a substantial gap compared to gains in real assets held by the first to third quintiles. As for changes in financial assets, however, there is no significant divergence between quintiles. Such asset increases driven by real assets started in 2017 and picked up speed in the wake of the Covid-19 pandemic.3)
As households in the top net worth has gained more wealth, wealth gap between households has been widening. The Gini coefficient for net worth—a measure of wealth inequality—has been on the steady rise since 2017, which is in contrast to the downward trend of the Gini coefficient for income resulting from mitigated income inequality (Figure 4). Despite a narrowing income gap, the widening wealth gap might be attributable to asset price rises.
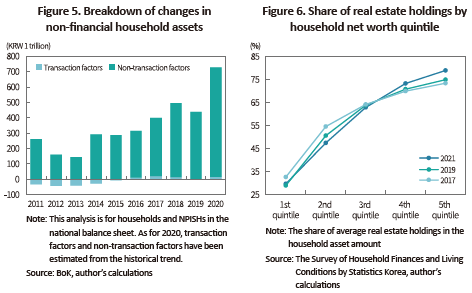
As shown in the national balance sheet, the increase in non-financial household assets has become steep since the mid-2010s (Figure 5). Changes in the non-financial asset value can be decomposed into transaction and non-transaction factors.4) The non-transaction factors such as price rises and value increases due to a change in land use take up most of the gains in non-financial assets, implying that rising property prices have amplified gains in household assets.
In Korea, households with a greater net worth tend to have a larger share of real estate holdings (Figure 6). Accordingly, high-wealth households can make more gains from real estate price increases, contributing to a widening wealth gap.
In Korea, households with a greater net worth tend to have a larger share of real estate holdings (Figure 6). Accordingly, high-wealth households can make more gains from real estate price increases, contributing to a widening wealth gap.
Household debt: A sharp increase in financial liabilities of households with heads aged under 50, primarily driven by housing loans
In terms of indebtedness, rising real estate prices have heterogeneous effects across household segments. When compared with households with their heads over the age of 50, financial liabilities held by households with heads aged under 50 have increased more sharply (Figure 7). Loans taken out by household heads under the age of 50 have surged across all net worth quintiles. It is also notable that lower wealth households in the first to third quintiles have seen their financial liabilities rising substantially.
Households with their heads aged under 50 tend to have a relatively lower home ownership rate5) and their housing loans account for the largest proportion of the financial liabilities.6) However, the purpose of loans has varied by net worth quintile. As for the fourth and fifth quintiles, the proportion of loans for the purchase of residential housing has been on the rise while that has declined steeply among households in the first to third quintiles since 2017 (Figure 8).
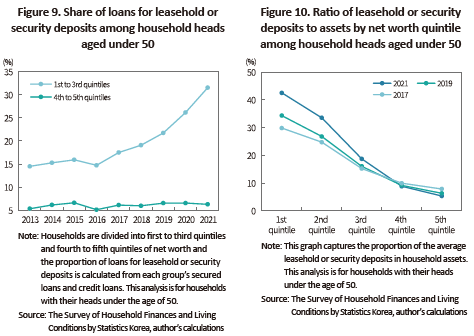
On the other hand, the share of loans for leasehold (jeonse) or security deposits has been increasing among households in the first to third quintiles (Figure 9). As leasehold transactions account for a large proportion in Korea’s rental market, households with a smaller net worth tend to have a greater share of the leasehold or security deposit in the total amount of assets.7) This suggests households with a smaller net worth (in the first to third quintiles) take out more loans owing to the rising burden of deposits driven by real estate price growth (Figure 10), which weighs on their balance sheet.
In Korea, the financial structure of households is susceptible to real estate price fluctuations as they have a relatively larger share of property assets. A steep rise in real estate prices pushes up the asset value of high-wealth households with a larger share of real assets. However, this could aggravate the burden of raising deposits on lower wealth households, thereby compromising financial soundness. In this respect, the government should strive to prevent property prices from soaring sharply by managing housing supply and demand and financial conditions.
It is also noteworthy that those aged under 50 have recently seen their financial liabilities ballooning due to real estate price increases over the past several years (Figure 11). Such households are increasingly threatened by interest rate rises as the burden of repayment of the principal and interest is growing at a rapid pace (Figure 12). Currently, a shift to monetary tightening in Korea and abroad is raising concerns about an economic slowdown and a greater burden of debt service payment. What is needed at this juncture is thorough preparation to keep financially unstable households from acting as weak points in the economy.
1) The Survey of Household Finances and Living Conditions does not provide statistics regarding crypto asset holdings by households.
2) In this article, the households analyzed are divided into five groups by the size of net worth, each of which includes the same number of households. Households in the bottom 20% net worth fall into the first quintile while those in the top 20% represent the fifth quintile.
3) Changes in assets and debts by net worth quintile can be divided based on the timeline of the Covid-19 pandemic as follows.
4) Transaction factors include net gains from transactions with other economic agents, while non-transaction factors include gains or losses arising from price fluctuations and value increases due to a change in land use.
5) The home ownership rate by age of household heads (based on the 2021 home ownership statistics): 10.5% for those aged under 30, 40.2% for those in their 30s, 59.3% for those in their 40s, 63.6% for those in their 50s, 67.6% for those aged over 60.
6) The purpose of secured loans and credit loans taken out by household heads aged under 50 can be broken down into residential housing purchase (46.2%), leasehold or security deposits (17.4%), buying real estate other than residential housing (15.1%), and raising business funds (10.3%) (as of end-March 2021).
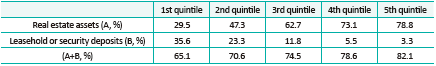
7) There is a wide divergence in the share of real estate assets by net worth quintile. If leasehold or security deposits are included, however, the divergence would be narrowed considerably. The proportion of real estate assets and leasehold or security deposits by net worth quintile is as follows (as of end-March 2021).
2) In this article, the households analyzed are divided into five groups by the size of net worth, each of which includes the same number of households. Households in the bottom 20% net worth fall into the first quintile while those in the top 20% represent the fifth quintile.
3) Changes in assets and debts by net worth quintile can be divided based on the timeline of the Covid-19 pandemic as follows.
4) Transaction factors include net gains from transactions with other economic agents, while non-transaction factors include gains or losses arising from price fluctuations and value increases due to a change in land use.
5) The home ownership rate by age of household heads (based on the 2021 home ownership statistics): 10.5% for those aged under 30, 40.2% for those in their 30s, 59.3% for those in their 40s, 63.6% for those in their 50s, 67.6% for those aged over 60.
6) The purpose of secured loans and credit loans taken out by household heads aged under 50 can be broken down into residential housing purchase (46.2%), leasehold or security deposits (17.4%), buying real estate other than residential housing (15.1%), and raising business funds (10.3%) (as of end-March 2021).
7) There is a wide divergence in the share of real estate assets by net worth quintile. If leasehold or security deposits are included, however, the divergence would be narrowed considerably. The proportion of real estate assets and leasehold or security deposits by net worth quintile is as follows (as of end-March 2021).