Our bi-weekly Opinion provides you with latest updates and analysis on major capital market and financial investment industry issues.
A Review on the Gap between US Stock Market and Real Economy
Publication date Jul. 21, 2020

Summary
In 2020, the global stock market managed to rebound from drastic downward adjustments triggered by the Covid-19 pandemic, with some of the major indexes recovering to the end-2019 level. Although the real economy has yet to fully recover from the bottom in March and April despite a slight rebound with resumed economic activities in May, concerns are rising about the gap between the real economy and stock market.
Although looking somewhat divergent from real economic conditions, the stock market, usually preceding the real economy, seems to pre-reflect the possibility of a rebound from the second quarter trough in the second half of 2020. Hence, the path of recovery in the near future is a key determinant of whether a gap will actually occur between the real economy and the stock market or not. As the Covid-19 pandemic makes any future projection highly uncertain, market participants should closely monitor the path of recovery in the second half of this year so as to properly respond to the market. Policy authorities also have a role to play for normalizing economic activities and stabilizing the financial markets by carefully watching the financial markets and the real economy.
Although looking somewhat divergent from real economic conditions, the stock market, usually preceding the real economy, seems to pre-reflect the possibility of a rebound from the second quarter trough in the second half of 2020. Hence, the path of recovery in the near future is a key determinant of whether a gap will actually occur between the real economy and the stock market or not. As the Covid-19 pandemic makes any future projection highly uncertain, market participants should closely monitor the path of recovery in the second half of this year so as to properly respond to the market. Policy authorities also have a role to play for normalizing economic activities and stabilizing the financial markets by carefully watching the financial markets and the real economy.
At the beginning of 2020, the global stock market opened in an upbeat mood thanks to the US-China trade deal and expectations for global economic recovery. The market was on the steady rise even when the Covid-19 spread in China and some of the Asian regions. When the virus hit Italia, Europe, and the US and became a global pandemic, the global stock market had abrupt adjustments. The shutdown in the US and Europe contracted economic activities and raised concerns about the rising possibility of default and a sudden economic downturn, which put the financial markets into panic mode. The financial markets resumed stability only after the US and other developed economies had implemented aggressive monetary and fiscal policies including liquidity provision.
When the shutdown ended in the US and Europe in May 2020 and economic activities slowly resumed, the global stock market managed to rebound, with some of the major indexes returning to the levels reached at the end of 2019. However, real economic indicators have yet to recover: Although they began rebounding slightly with economic activities beginning in May after hitting the bottom with the lockdown announcement in March and April, the real economy is still far below normal levels. On June 25, 2020, the IMF made a drastic downward adjustment in global economic growth outlook. In its Global Financial Stability Report, it expressed concerns that the ongoing gap between the real economy and financial markets could lead to an adjustment in asset value.
Since the Covid-19 pandemic, Korea’s financial markets reacted sensitively1) to US conditions. Under the circumstances, this article tries to explore how economic activities resumed and the stock market recovered, with the focus placed on the US case where past data on the real economy are readily available. Based on a comparative look at how the US stock market rebounded during past contraction phases, this article seeks to assess expectations in the rapidly recovered stock market, and to discuss some implications.
Business cycles and stock market
Corporate activities are linked to economic conditions. Financial market indicators representing corporate activities include stock market indexes and credit spreads, both of which are closely linked to business cycles.2) During the expansion phase where growth is higher than potential growth, corporate earnings increase and a stock market climbs, whereas credit spreads narrow. During the contraction phase,3) economic growth falls short of potential growth, and a contraction in business activities sends the stock market into an adjustment and causes credit spreads to widen. Normally, a stock market tends to rebound right before the trough, but this time, the rebound began two to five months before the trough (the right end of the each graph) as illustrated in Figure 1. It is after the trough when the economy begins normalizing to grow above the potential growth rate. The stock market seems to reflect that trend in advance.
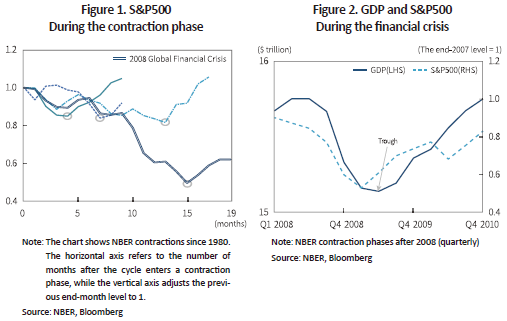
Figure 2 demonstrates the correlation between the recovery from the 2008 financial crisis and the stock index in the previous contraction phase. The S&P500 at that time first dipped over 50% from the end-2007 level until the first quarter of 2009. The market began rebounding in the second quarter of 2009 from the bottom and reached as high as 80% of the end-2007 level in the first quarter of 2010.4)
Spreading of Covid-19 and stock market
The spread of the Covid-19 in 2020 triggered lockdowns and contracted economic activities, which downgraded firms’ credit ratings and exacerbated concerns about an abrupt economic recession. Under the circumstances, the stock market also had a dramatic downward adjustment. As a contraction in the credit market and liquidity crises destabilized the financial markets, the stock market pre-reflected the real economic downturn to nosedive in March 2020.5) However, the financial markets began getting stabilized on March 24 by expectations triggered by the announcements of the Fed’s unlimited quantitative easing and corporate bond purchases and the government’s large-scale fiscal boosts. Although this is partly due to eased concerns about a credit crunch and liquidity risk in the financial markets, the primary reason behind the recovery came from expectations that the real economy would get back to recovery in the second half of this year if economic activities resume and fiscal policies create positive effects.
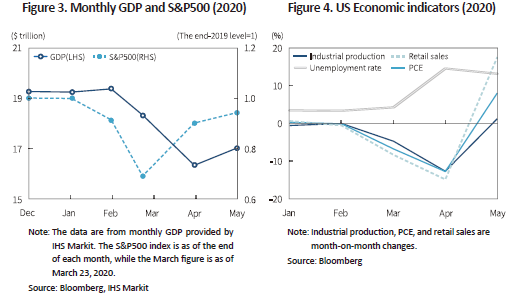
Although the financial markets got stabilized and the stock market hit the bottom to rebound on March 23, real economic indicators are showing worst-ever conditions in March and April amid Covid-19 lockdowns, as illustrated in Figure 3 and Figure 4. When the lockdowns ended one after another in the US and European nations at the end of April, economic activities resumed and consumer indicators turned around to an increase in May. Presumably, the stock market could have reflected that trend in advance to recover rapidly. The rebound in the S&P500 index seems to be based on recovery expectations that the economy would soon be back on track in the second half of 2020 from the second-quarter trough if the Covid-19 subsides without the second wave.6)
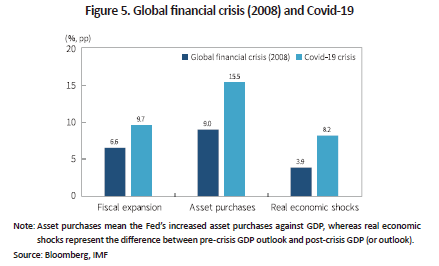
Despite recovery expectations, however, the S&P500 index recovering to the end-2019 level seems somewhat excessive given Covid-19 shocks to the real economy. Although shocks from the Covid-19 crisis on the real economy were larger than those from the 2008 global financial crisis, also larger was the size of monetary loosening and fiscal expansion as shown in Figure 5. That could possibly help stabilize the financial markets and facilitate recovery in the stock market ahead of a recovery in the real economy. More importantly, that fueled recovery expectations.
Covid-19 and individual stock performance
The impacts of Covid-19 on the stock market have a few characteristics. Among others, lockdowns and social distancing widened the profitability gap across industries, individual firms, and their business activities. When the Covid-19 pandemic spread further, the profitability gap widened further depending on a firm’s industry, the relative proportion of overseas operations, its cash holdings and leverage.7) Also affecting the gap is the level of lockdowns and economic activities. Market responses to the Covid-19 pandemic could be measured by a comparative look at the performance gap between individual stocks.
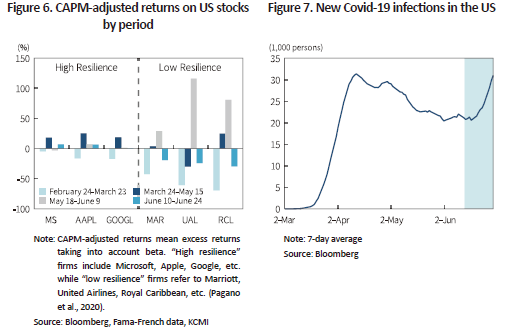
Figure 7 is a chart showing CAPM-adjusted returns on Covid-19 stocks that were categorized into groups depending on resilience levels. Resilience here is assessed by how well a firm’s business activities can strike a balance with social distancing, which takes into account the possibility of remote working, employee interactions and closeness, etc.8) “Low resilience” firms underperformed not only during the abrupt market decline between February 24 and March 23, but also during the rebound between March 24 and May 15. However, those firms generated relatively high returns during the rebound in economic activities and rising expectations for a Covid-19 vaccine between May 18 and June 9. During the rebound period, expectations for economic recovery rose further, pushing up the S&P500 index to close at the end-2019 level on June 8. During the last period between June 10 and June 24 in Figure 6, low resilience firms began underperforming again, reflecting rising Covid-19 concerns in the US where the number of new infections turned around to an increase and some states including Texas were shut down again (Figure 7). It was during the last period when the S&P500 index recorded the lowest return of -5% due to another lockdown and increased concerns about a stalled recovery. Such a condition poses the largest risk factor where the real economy and the stock market could actually diverge going forward.
Conclusion
The global stock market had a dramatic downward adjustment as the Covid-19 pandemic spread further, but rebounded quickly with some of the indexes recovering to the end-2019 level. However, a real economic recovery has yet to come. Despite growing concerns about the gap between the real economy and the stock market, the stock market seems to expect resumed economic activities to lead to a recovery in the second half of this year from the second quarter bottom. Also observable is that monetary loosening and fiscal expansion helped stabilize the financial market and underpinned the stock market recovery ahead of a real economic recovery despite the sheer size of shocks from lockdowns to the real economy. Nevertheless, another economic lockdown due to the second wave of the pandemic is the largest risk factor as it could delay an economic recovery and lead to an actual gap between the real economy and the stock market.9)
It’s possible to apply what’s observed above to interpreting Korea’s stock market. The aforementioned gap will occur depending on whether Korea’s economy recovers in the second half of this year or not, which makes it even more important for Korea to normalize and stabilize its economy and financial markets. Now that the lingering pandemic makes any projection of the future highly uncertain, market participants should closely monitor the path of economic recovery when responding to market changes in the second half of this year. What policy authorities should do is to pay close attention to any change in the financial markets and the real economy, while playing their role in helping economic activities to get back to pre-pandemic trajectory and the financial markets to remain stable. Another implication from the case of resilience firms in this article is the necessity of firms to work hard to come up with their own strategy for normalizing business activities while striking a balance between quarantine and social distancing.
1) During the period between February 21 and June 26 after the Covid-19 outbreak, the correlation coefficient of the KOSPI and S&P500 stood at 0.93.
2) KCMI, Economic and Capital Market Outlook, 2H 2018; KCMI, Economic and Capital Market Outlook, 1H 2019.
3) The expansion (contraction) phase in this article represents the period between the previous trough (peak) to the peak (trough) in the NBER business cycle.
4) During the same period, the GDP gap showed a 44% decrease in negative gaps from -3.5% to -1.9%. The GDP gap here is (Real GDP-Potential GDP)/(Potential GDP).
5) Between February 21 and March 23, the S&P500 and KOSPI indexes fell 31% and 33%, respectively.
6) The trough was reached in the second quarter of 2020, and the negative GDP gap is projected to decrease 42% from -10.3% in Q2 2020 to -5.9% in 4Q 2020 (refer to Economic and Capital Market Outlook, 1H 2020, KCMI).
7) Kim (2020); Ramelli & Wagner (2020)
8) Pagano et al. (2020)
9) In its Financial Stability Report out on June 25, the IMF mentioned that trade disputes and monetary policy changes in major economies on top of the Covid-19’s second wave could be risk factors behind a possible stock market adjustment.
References
Koren, M., Peto, R., 2020, Business disruptions from social distancing, Covid Economics 2(CEPR), 13–31.
Pagano, M., Wagner, C., Zechner J., 2020, Disaster resilience and asset prices, Covid Economics 21(CEPR), 1-39.
Ramelli, S., Wagner, A. F., 2020, Feverish stock price reactions to Covid-19, Swiss Finance Institute Research Paper Series.
(Korean)
KCMI, 2H 2018, Economic and Capital Market Outlook.
KCMI, 1H 2019, Economic and Capital Market Outlook.
KCMI, 1H 2020, Economic and Capital Market Outlook.
Kim, J.S., 2020, Covid-19’s impacts on Korea’s stock market, Capital Market Focus 2020-6.
When the shutdown ended in the US and Europe in May 2020 and economic activities slowly resumed, the global stock market managed to rebound, with some of the major indexes returning to the levels reached at the end of 2019. However, real economic indicators have yet to recover: Although they began rebounding slightly with economic activities beginning in May after hitting the bottom with the lockdown announcement in March and April, the real economy is still far below normal levels. On June 25, 2020, the IMF made a drastic downward adjustment in global economic growth outlook. In its Global Financial Stability Report, it expressed concerns that the ongoing gap between the real economy and financial markets could lead to an adjustment in asset value.
Since the Covid-19 pandemic, Korea’s financial markets reacted sensitively1) to US conditions. Under the circumstances, this article tries to explore how economic activities resumed and the stock market recovered, with the focus placed on the US case where past data on the real economy are readily available. Based on a comparative look at how the US stock market rebounded during past contraction phases, this article seeks to assess expectations in the rapidly recovered stock market, and to discuss some implications.
Business cycles and stock market
Corporate activities are linked to economic conditions. Financial market indicators representing corporate activities include stock market indexes and credit spreads, both of which are closely linked to business cycles.2) During the expansion phase where growth is higher than potential growth, corporate earnings increase and a stock market climbs, whereas credit spreads narrow. During the contraction phase,3) economic growth falls short of potential growth, and a contraction in business activities sends the stock market into an adjustment and causes credit spreads to widen. Normally, a stock market tends to rebound right before the trough, but this time, the rebound began two to five months before the trough (the right end of the each graph) as illustrated in Figure 1. It is after the trough when the economy begins normalizing to grow above the potential growth rate. The stock market seems to reflect that trend in advance.
Figure 2 demonstrates the correlation between the recovery from the 2008 financial crisis and the stock index in the previous contraction phase. The S&P500 at that time first dipped over 50% from the end-2007 level until the first quarter of 2009. The market began rebounding in the second quarter of 2009 from the bottom and reached as high as 80% of the end-2007 level in the first quarter of 2010.4)
Spreading of Covid-19 and stock market
The spread of the Covid-19 in 2020 triggered lockdowns and contracted economic activities, which downgraded firms’ credit ratings and exacerbated concerns about an abrupt economic recession. Under the circumstances, the stock market also had a dramatic downward adjustment. As a contraction in the credit market and liquidity crises destabilized the financial markets, the stock market pre-reflected the real economic downturn to nosedive in March 2020.5) However, the financial markets began getting stabilized on March 24 by expectations triggered by the announcements of the Fed’s unlimited quantitative easing and corporate bond purchases and the government’s large-scale fiscal boosts. Although this is partly due to eased concerns about a credit crunch and liquidity risk in the financial markets, the primary reason behind the recovery came from expectations that the real economy would get back to recovery in the second half of this year if economic activities resume and fiscal policies create positive effects.
Although the financial markets got stabilized and the stock market hit the bottom to rebound on March 23, real economic indicators are showing worst-ever conditions in March and April amid Covid-19 lockdowns, as illustrated in Figure 3 and Figure 4. When the lockdowns ended one after another in the US and European nations at the end of April, economic activities resumed and consumer indicators turned around to an increase in May. Presumably, the stock market could have reflected that trend in advance to recover rapidly. The rebound in the S&P500 index seems to be based on recovery expectations that the economy would soon be back on track in the second half of 2020 from the second-quarter trough if the Covid-19 subsides without the second wave.6)
Despite recovery expectations, however, the S&P500 index recovering to the end-2019 level seems somewhat excessive given Covid-19 shocks to the real economy. Although shocks from the Covid-19 crisis on the real economy were larger than those from the 2008 global financial crisis, also larger was the size of monetary loosening and fiscal expansion as shown in Figure 5. That could possibly help stabilize the financial markets and facilitate recovery in the stock market ahead of a recovery in the real economy. More importantly, that fueled recovery expectations.
Covid-19 and individual stock performance
The impacts of Covid-19 on the stock market have a few characteristics. Among others, lockdowns and social distancing widened the profitability gap across industries, individual firms, and their business activities. When the Covid-19 pandemic spread further, the profitability gap widened further depending on a firm’s industry, the relative proportion of overseas operations, its cash holdings and leverage.7) Also affecting the gap is the level of lockdowns and economic activities. Market responses to the Covid-19 pandemic could be measured by a comparative look at the performance gap between individual stocks.
Figure 7 is a chart showing CAPM-adjusted returns on Covid-19 stocks that were categorized into groups depending on resilience levels. Resilience here is assessed by how well a firm’s business activities can strike a balance with social distancing, which takes into account the possibility of remote working, employee interactions and closeness, etc.8) “Low resilience” firms underperformed not only during the abrupt market decline between February 24 and March 23, but also during the rebound between March 24 and May 15. However, those firms generated relatively high returns during the rebound in economic activities and rising expectations for a Covid-19 vaccine between May 18 and June 9. During the rebound period, expectations for economic recovery rose further, pushing up the S&P500 index to close at the end-2019 level on June 8. During the last period between June 10 and June 24 in Figure 6, low resilience firms began underperforming again, reflecting rising Covid-19 concerns in the US where the number of new infections turned around to an increase and some states including Texas were shut down again (Figure 7). It was during the last period when the S&P500 index recorded the lowest return of -5% due to another lockdown and increased concerns about a stalled recovery. Such a condition poses the largest risk factor where the real economy and the stock market could actually diverge going forward.
The global stock market had a dramatic downward adjustment as the Covid-19 pandemic spread further, but rebounded quickly with some of the indexes recovering to the end-2019 level. However, a real economic recovery has yet to come. Despite growing concerns about the gap between the real economy and the stock market, the stock market seems to expect resumed economic activities to lead to a recovery in the second half of this year from the second quarter bottom. Also observable is that monetary loosening and fiscal expansion helped stabilize the financial market and underpinned the stock market recovery ahead of a real economic recovery despite the sheer size of shocks from lockdowns to the real economy. Nevertheless, another economic lockdown due to the second wave of the pandemic is the largest risk factor as it could delay an economic recovery and lead to an actual gap between the real economy and the stock market.9)
It’s possible to apply what’s observed above to interpreting Korea’s stock market. The aforementioned gap will occur depending on whether Korea’s economy recovers in the second half of this year or not, which makes it even more important for Korea to normalize and stabilize its economy and financial markets. Now that the lingering pandemic makes any projection of the future highly uncertain, market participants should closely monitor the path of economic recovery when responding to market changes in the second half of this year. What policy authorities should do is to pay close attention to any change in the financial markets and the real economy, while playing their role in helping economic activities to get back to pre-pandemic trajectory and the financial markets to remain stable. Another implication from the case of resilience firms in this article is the necessity of firms to work hard to come up with their own strategy for normalizing business activities while striking a balance between quarantine and social distancing.
1) During the period between February 21 and June 26 after the Covid-19 outbreak, the correlation coefficient of the KOSPI and S&P500 stood at 0.93.
2) KCMI, Economic and Capital Market Outlook, 2H 2018; KCMI, Economic and Capital Market Outlook, 1H 2019.
3) The expansion (contraction) phase in this article represents the period between the previous trough (peak) to the peak (trough) in the NBER business cycle.
4) During the same period, the GDP gap showed a 44% decrease in negative gaps from -3.5% to -1.9%. The GDP gap here is (Real GDP-Potential GDP)/(Potential GDP).
5) Between February 21 and March 23, the S&P500 and KOSPI indexes fell 31% and 33%, respectively.
6) The trough was reached in the second quarter of 2020, and the negative GDP gap is projected to decrease 42% from -10.3% in Q2 2020 to -5.9% in 4Q 2020 (refer to Economic and Capital Market Outlook, 1H 2020, KCMI).
7) Kim (2020); Ramelli & Wagner (2020)
8) Pagano et al. (2020)
9) In its Financial Stability Report out on June 25, the IMF mentioned that trade disputes and monetary policy changes in major economies on top of the Covid-19’s second wave could be risk factors behind a possible stock market adjustment.
References
Koren, M., Peto, R., 2020, Business disruptions from social distancing, Covid Economics 2(CEPR), 13–31.
Pagano, M., Wagner, C., Zechner J., 2020, Disaster resilience and asset prices, Covid Economics 21(CEPR), 1-39.
Ramelli, S., Wagner, A. F., 2020, Feverish stock price reactions to Covid-19, Swiss Finance Institute Research Paper Series.
(Korean)
KCMI, 2H 2018, Economic and Capital Market Outlook.
KCMI, 1H 2019, Economic and Capital Market Outlook.
KCMI, 1H 2020, Economic and Capital Market Outlook.
Kim, J.S., 2020, Covid-19’s impacts on Korea’s stock market, Capital Market Focus 2020-6.